Reconfigurable transmitarrays steer a beam electronically with a flat panel. A horn illuminates the panel, and PIN diodes in each cell set the phase of the wave it passes on. Because the whole antenna is electrically large and full of fine features, designers usually simulate one cell and predict the array analytically with approximations.
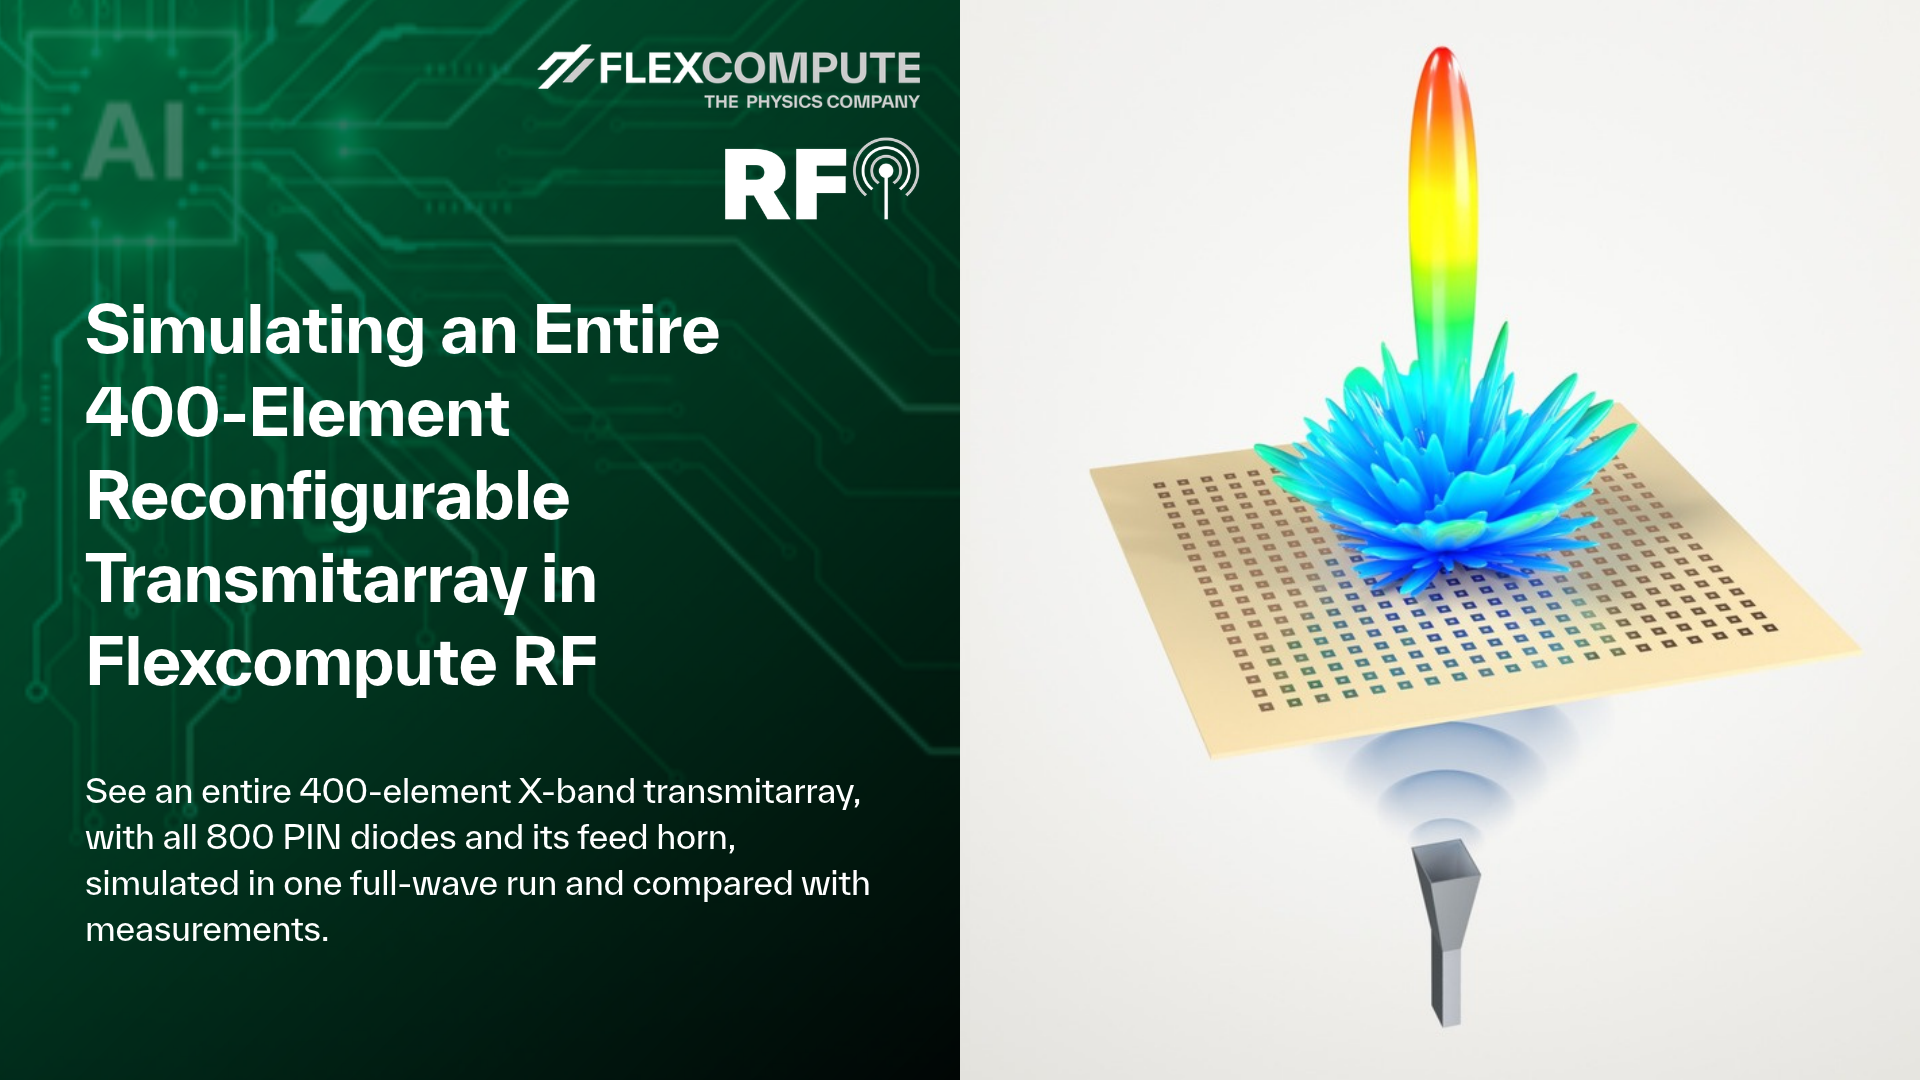
Here, we simulate the entire 400-element X-band transmitarray of Clemente et al. [1] in a single full-wave Flexcompute RF simulation, with all 800 PIN diodes and the feed horn, and compare it with their measurements.
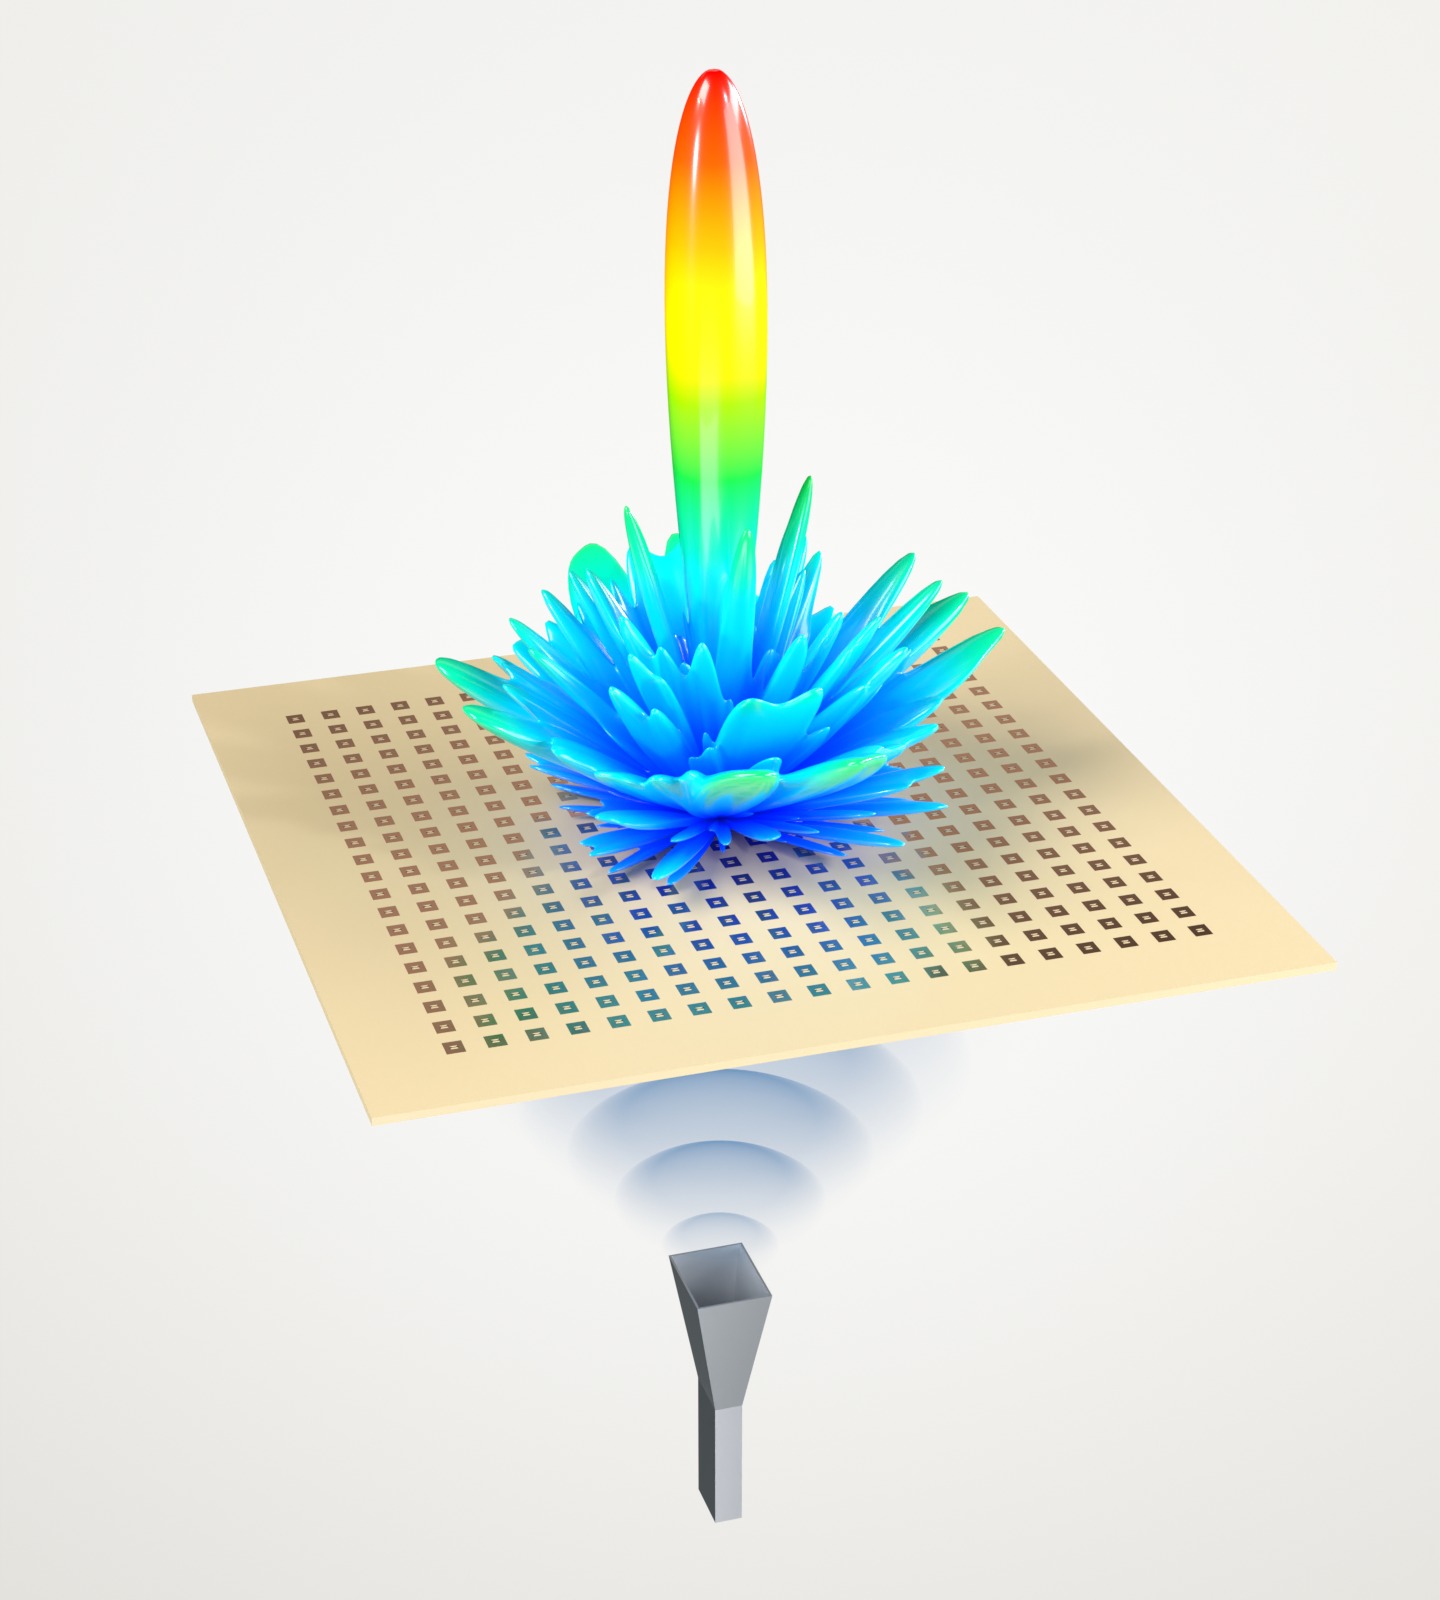
Figure 1. The simulated antenna and its 3D realized-gain pattern at 9.8 GHz, from blue (low gain) to red (peak). The wavefronts from the horn are illustrative.
Model setup
The antenna has 20 × 20 cells on a 15 mm pitch, fed by a horn 214 mm away. Two PIN diodes in each cell switch it between phase states 180° apart, and the paper's phase map points the beam at broadside.
The paper leaves a few dimensions open, so we first calibrated a single cell against the measured one; it matches the measured 2.1 dB insertion loss within 0.1 dB. The paper specifies the feed only as an 11.1 dBi standard-gain horn, so we designed one with similar gain and edge illumination.
The full model has 2.86 billion grid cells, with the 800 diodes as lumped elements, and ran in 3.8 hours. By our estimate, a traditional finite-element solver, which solves one frequency at a time, would need 150–300 GB of RAM and 3–7 days on a modern workstation to cover the same band for this model.
Because of that cost, large arrays like this are traditionally not simulated full-wave. Designers instead feed a periodic unit-cell simulation and the horn's pattern into an analytical array model, as the authors of [1] did. Such a model treats every cell as if it sat among identical neighbors and leaves out the aperture edges and the horn's spill-over; the authors of [1] attribute their larger discrepancies outside ±30° to these effects. Effects like these then show up only on the measured prototype, which can cost extra design iterations.
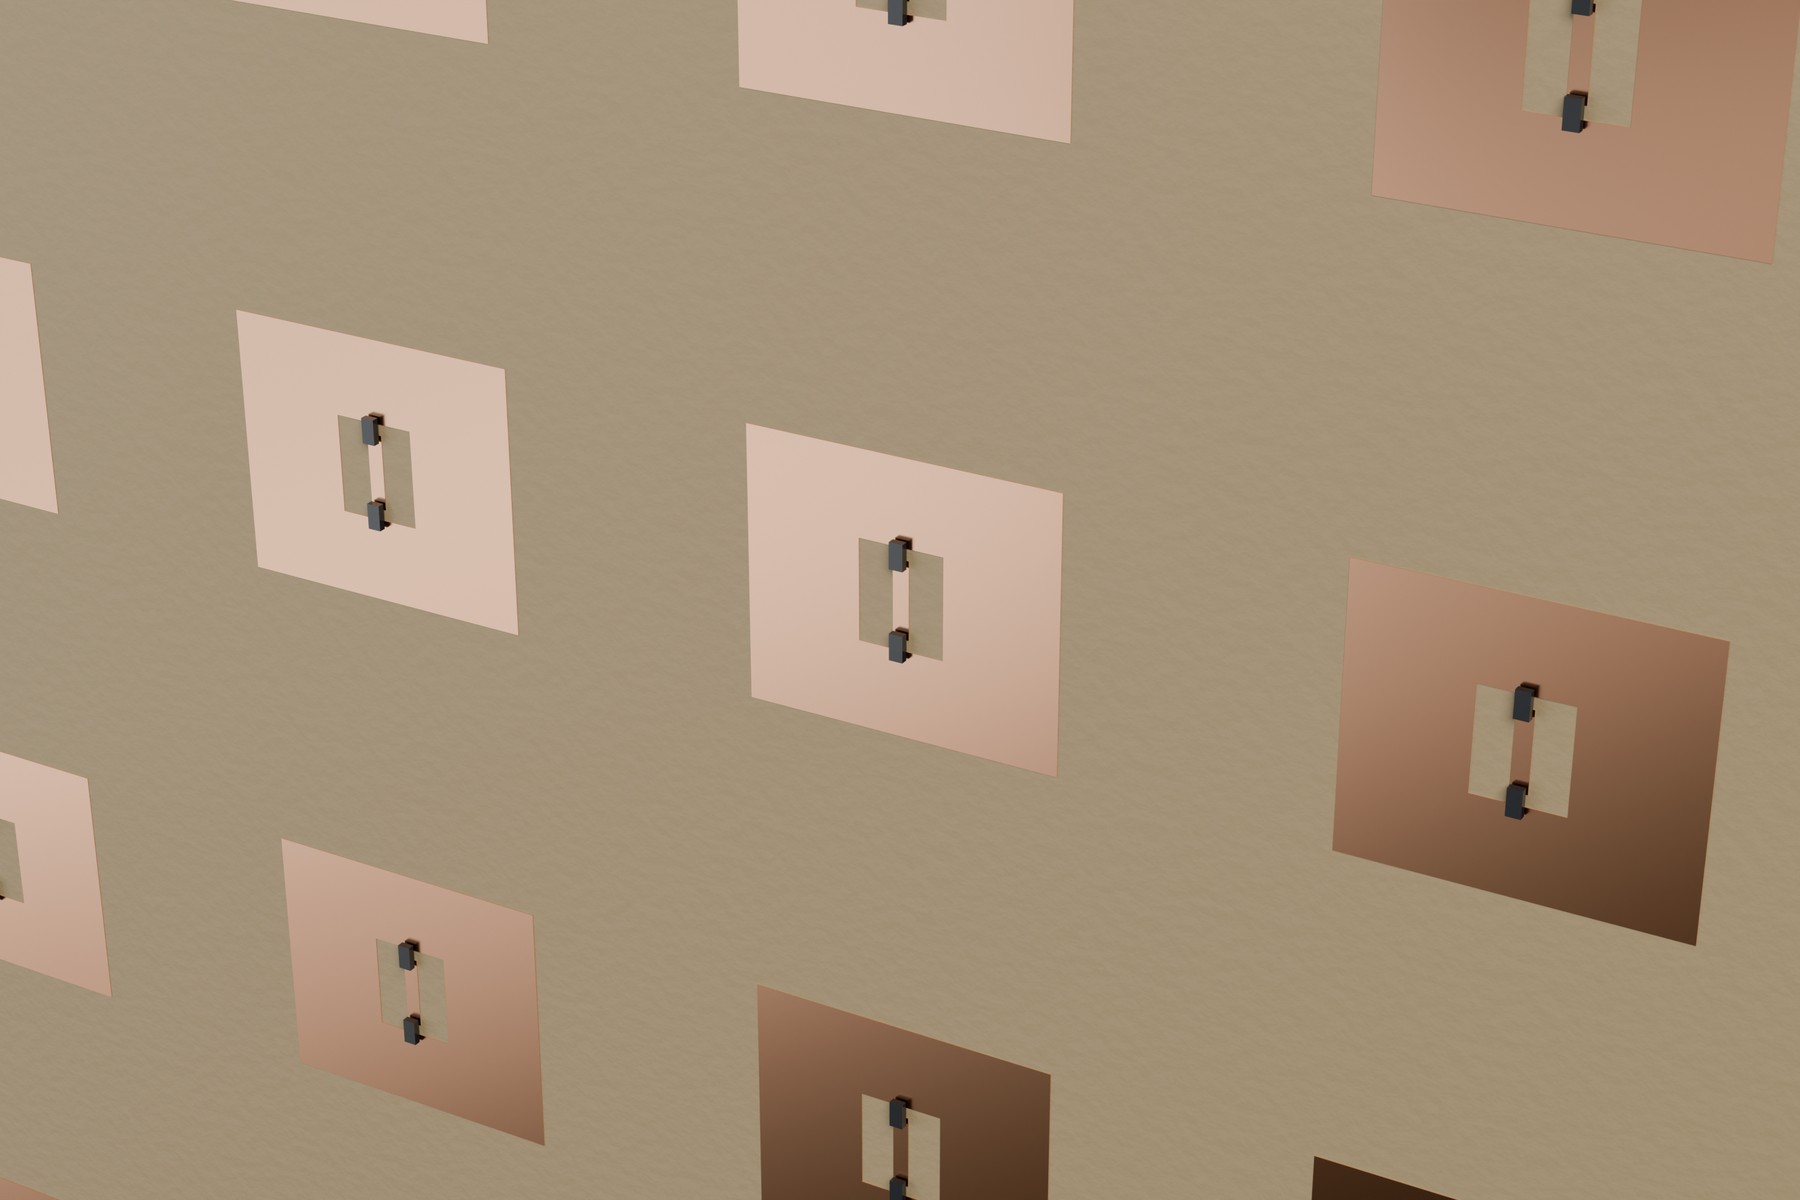
Figure 2. Cells on the radiating face of the board. Two PIN diodes (black) connect a copper island in each slot to its patch.
Results
| Quantity | Flexcompute RF | Measured [1] |
|---|---|---|
| Peak broadside realized gain | 22.9 dBi | 23.0 dBi |
| 3-dB gain band | 9.13–10.44 GHz | 9.02–10.59 GHz |
| 3-dB beamwidth, H-plane | 6.0° | 6.1° |
The simulated gain follows the measurement across the band (Figure 3). The main beams of the radiation patterns overlap (Figure 4). Beyond ±30°, where the horn's spill-over dominates, the simulation matches the measured E-plane side-lobe level within 1 dB, while the analytical model of [1] is about 4 dB low. In the H-plane the simulation is about 5 dB high, because the prototype's steering-logic boards, which we did not model, block part of the spill-over.
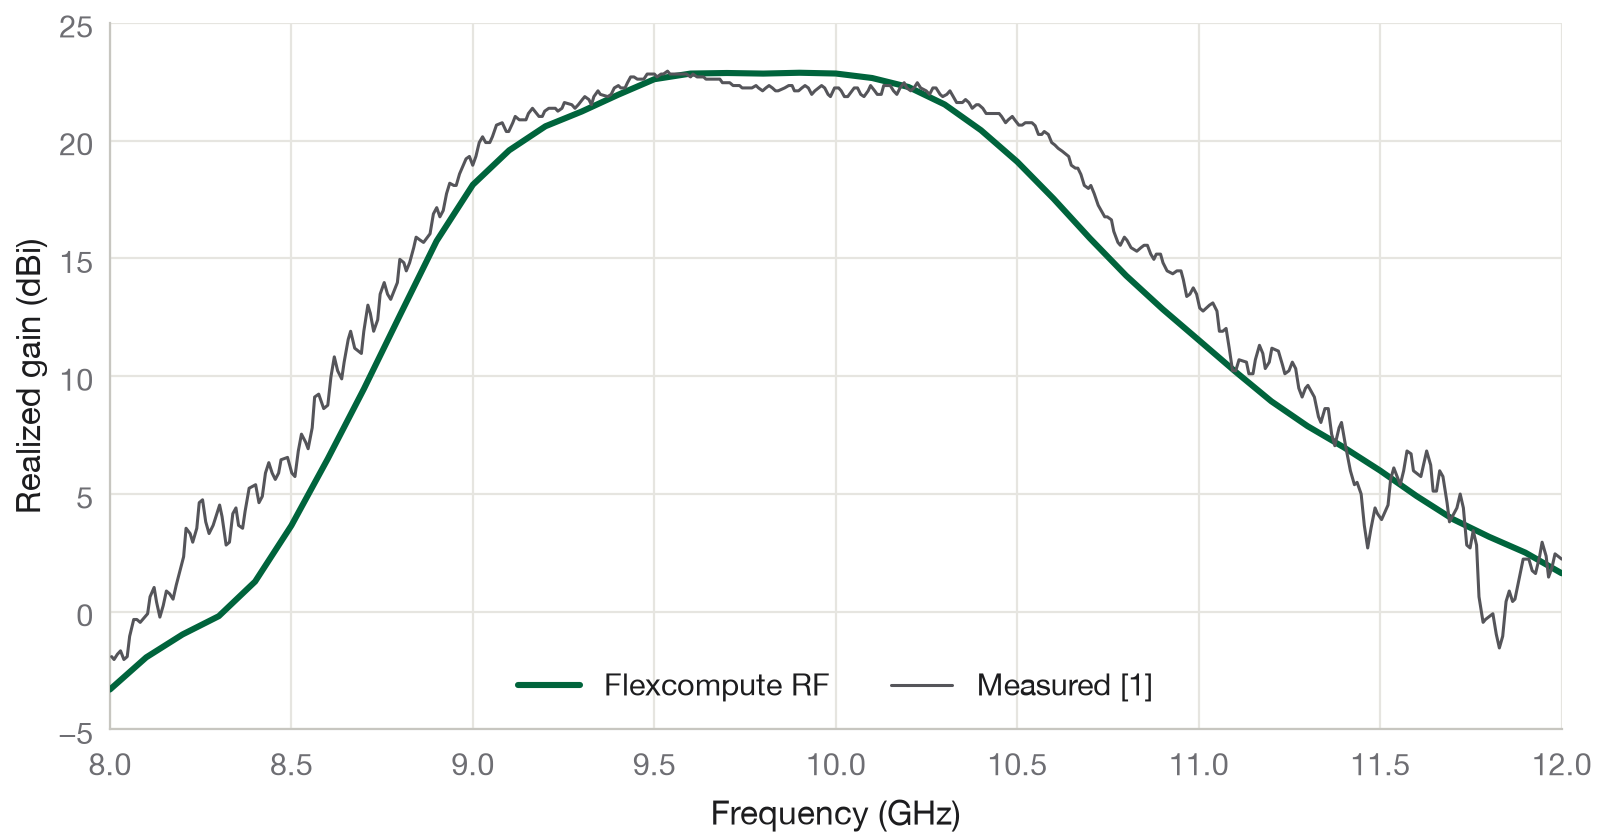
Figure 3. Broadside realized gain: Flexcompute RF (green) and measured [1] (grey).
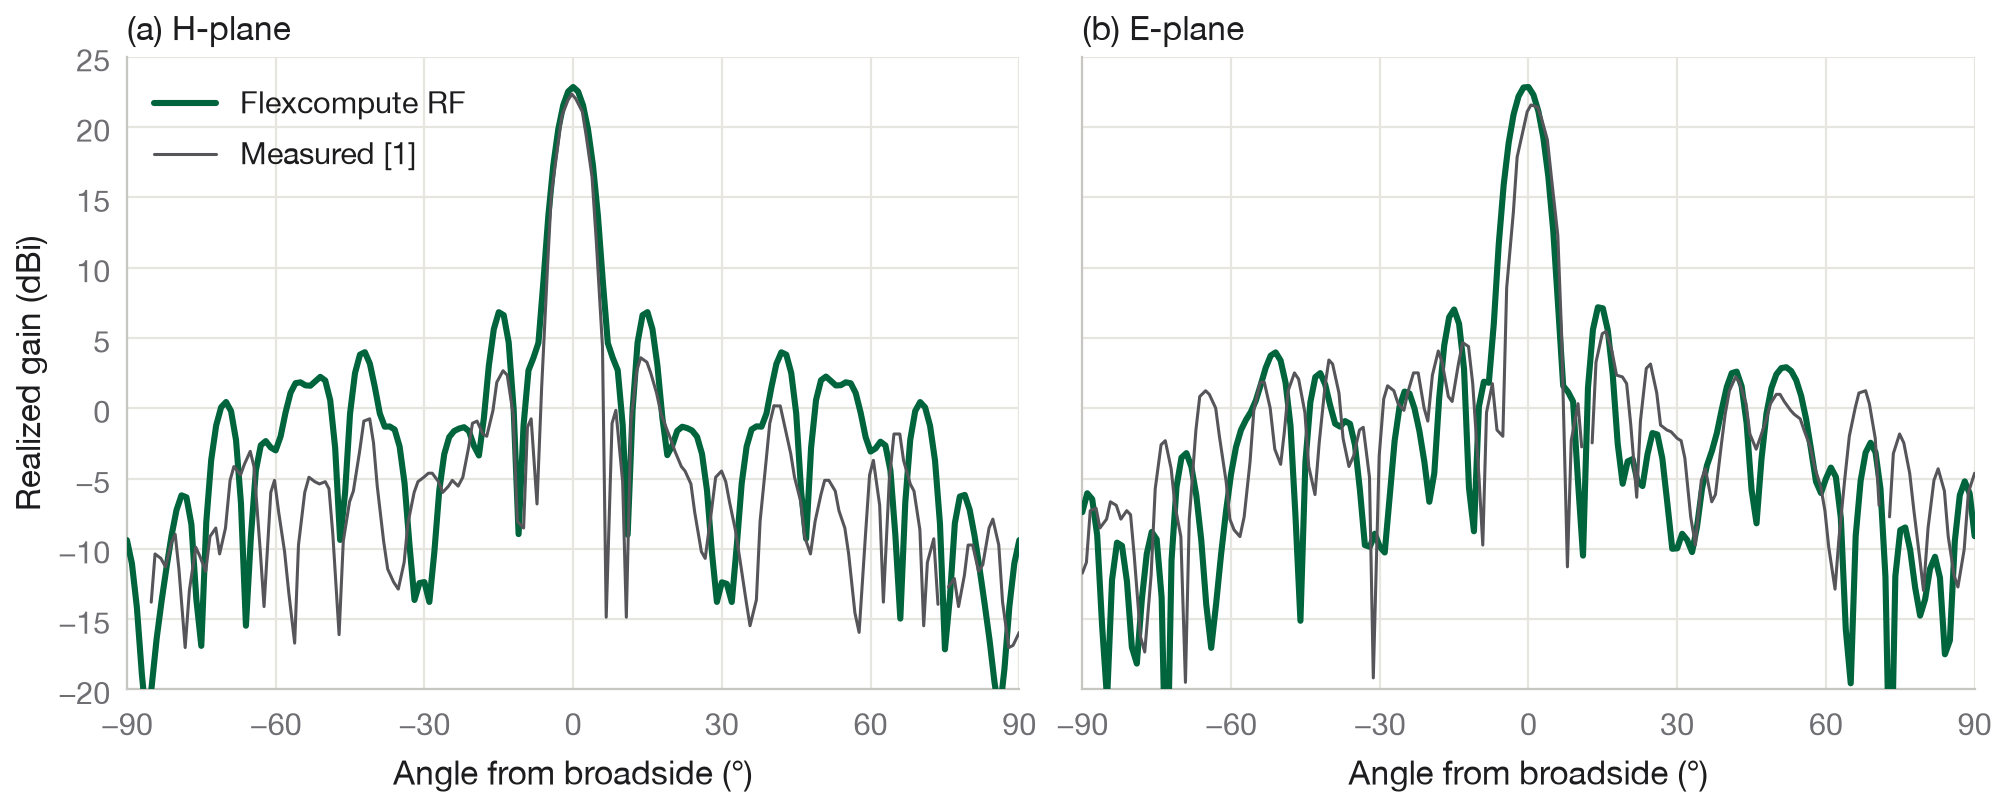
Figure 4. Realized gain at 9.8 GHz in the H-plane (a) and E-plane (b).
Download the example notebook: ReconfigurableTransmitarray.ipynb (ZIP)
References
[1] A. Clemente, L. Dussopt, R. Sauleau, P. Potier, and P. Pouliguen, "Wideband 400-element electronically reconfigurable transmitarray in X band," IEEE Transactions on Antennas and Propagation 61, 5017–5027 (2013). doi:10.1109/TAP.2013.2271493